Soil Profile Maps, originally intended as guides for the development of Florida’s agricultural and natural resource industries, are finding a new use as primary documents for historical researchers.
In the late 19th Century and early 20th, there was a major push by state and local governments for agricultural development throughout the entire state, not just in the southern and rural areas and an effort to exploit any and all natural resources the state had to offer.
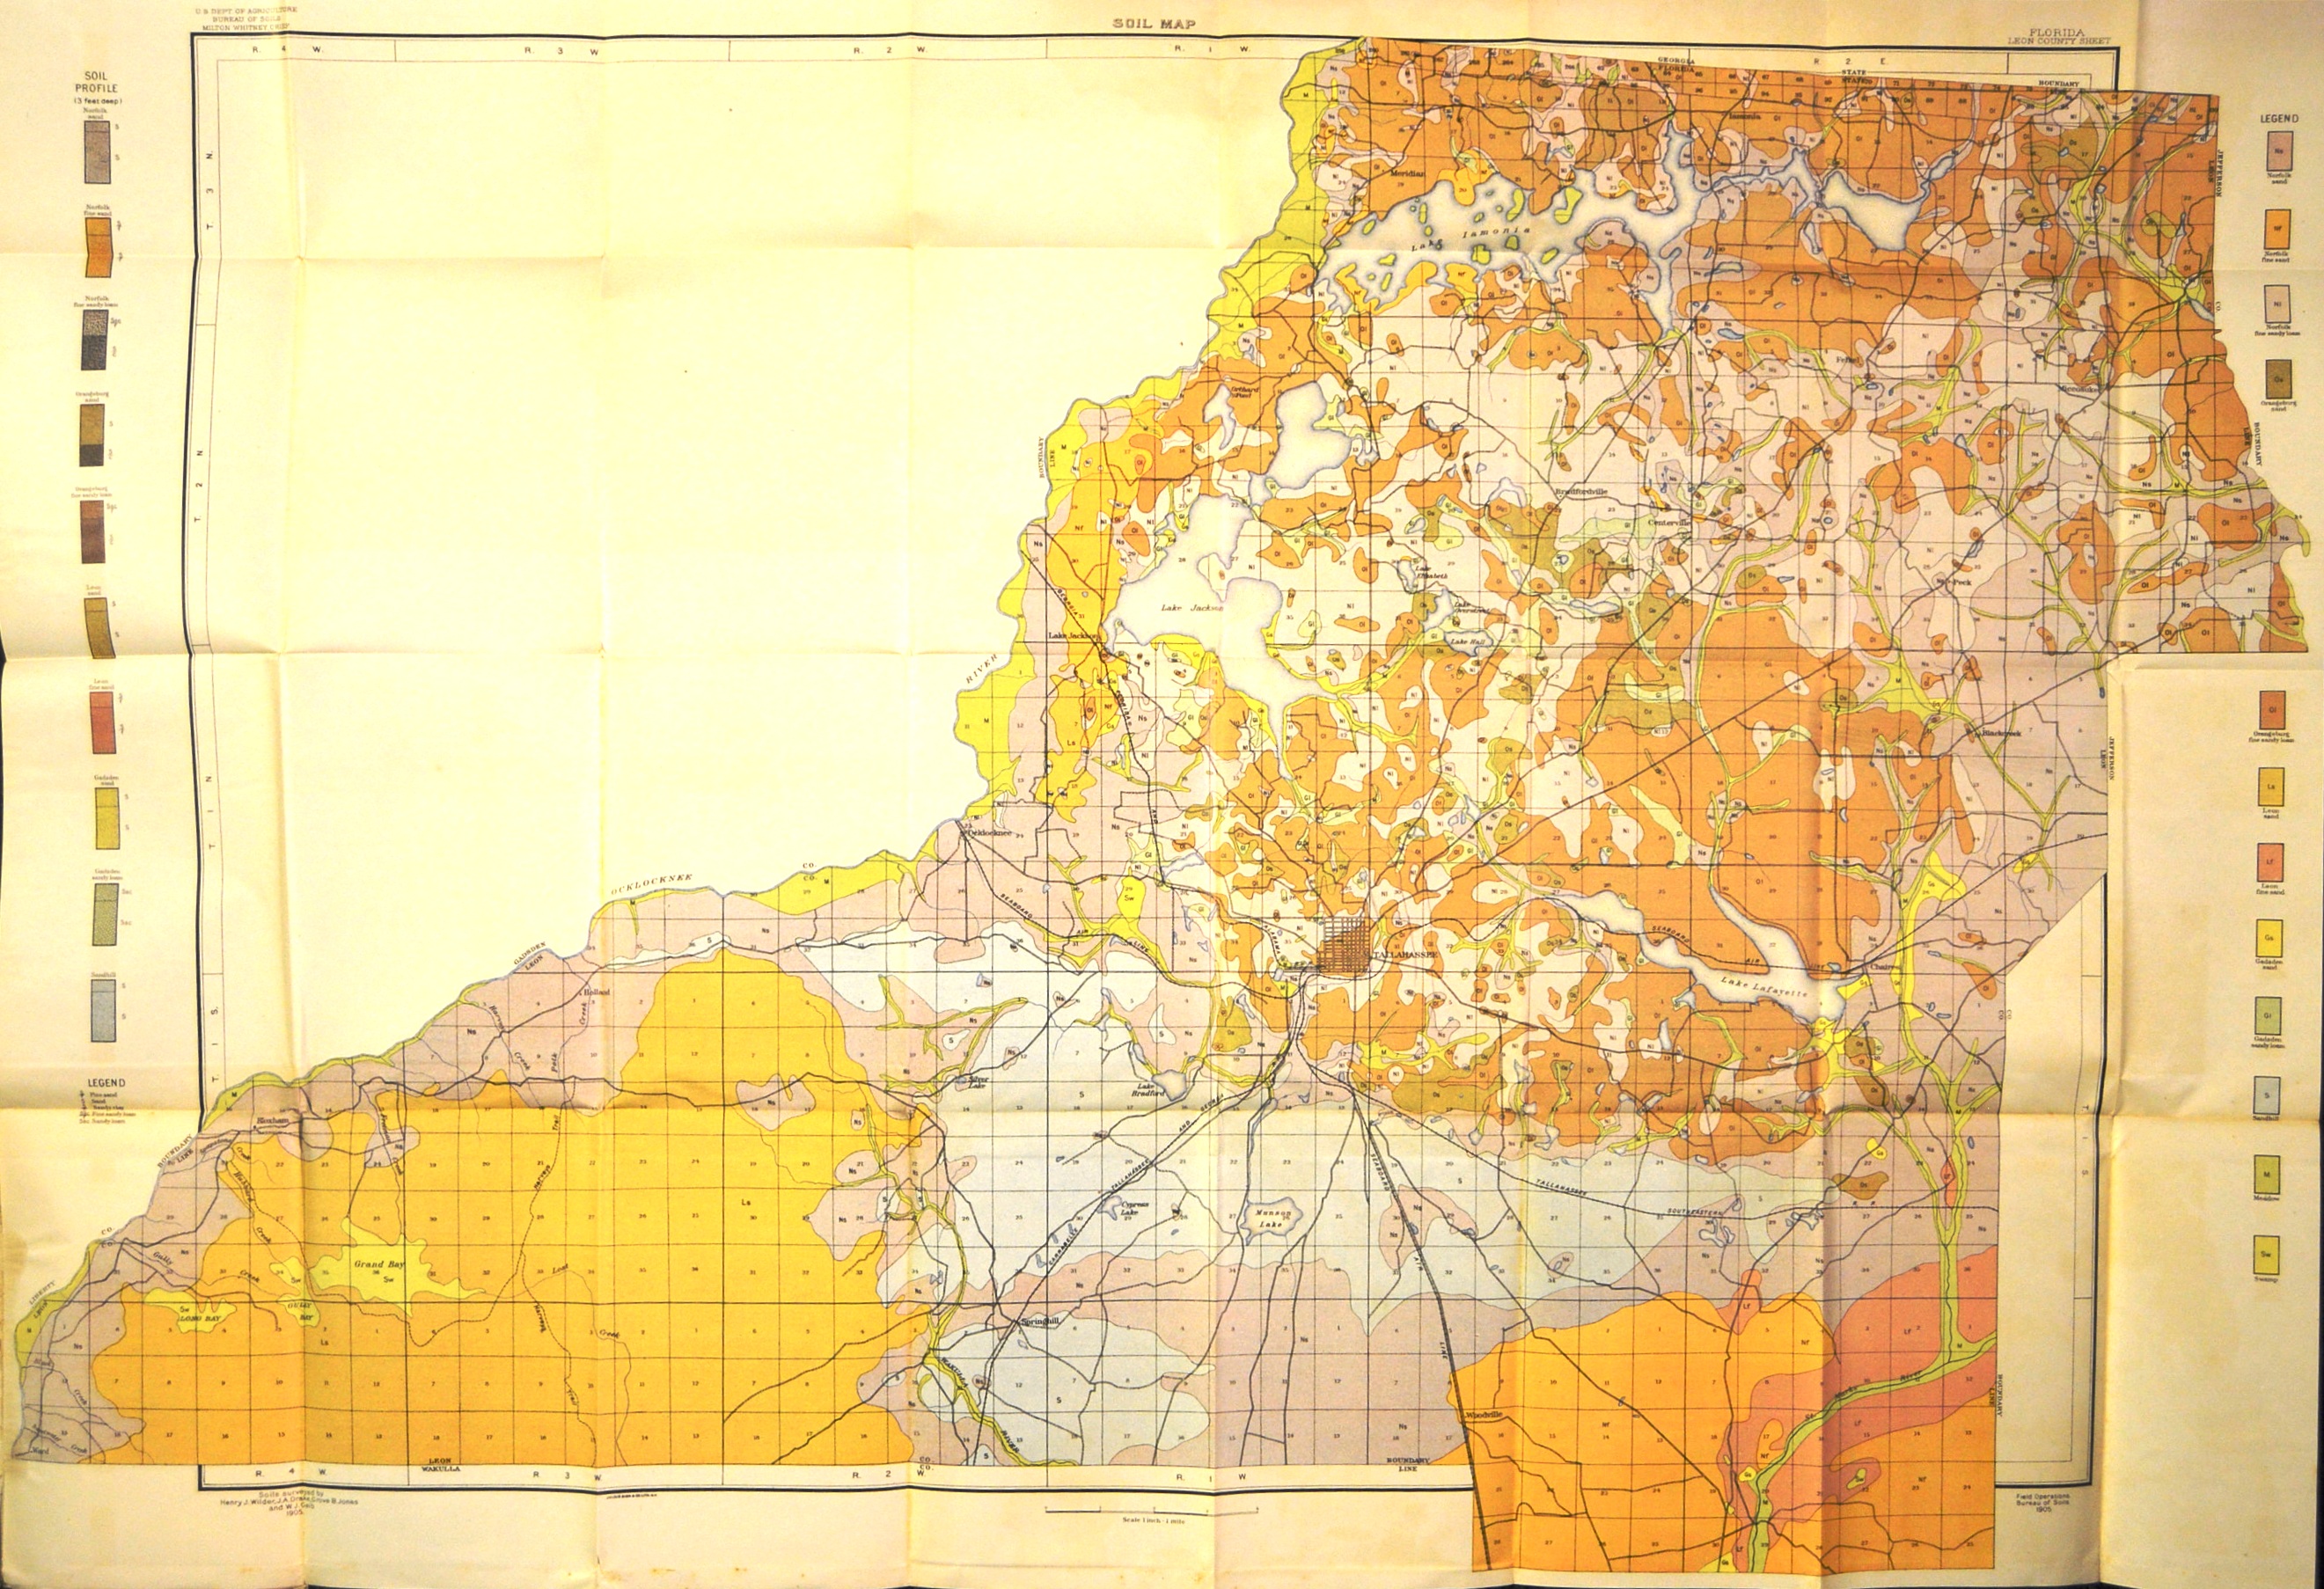
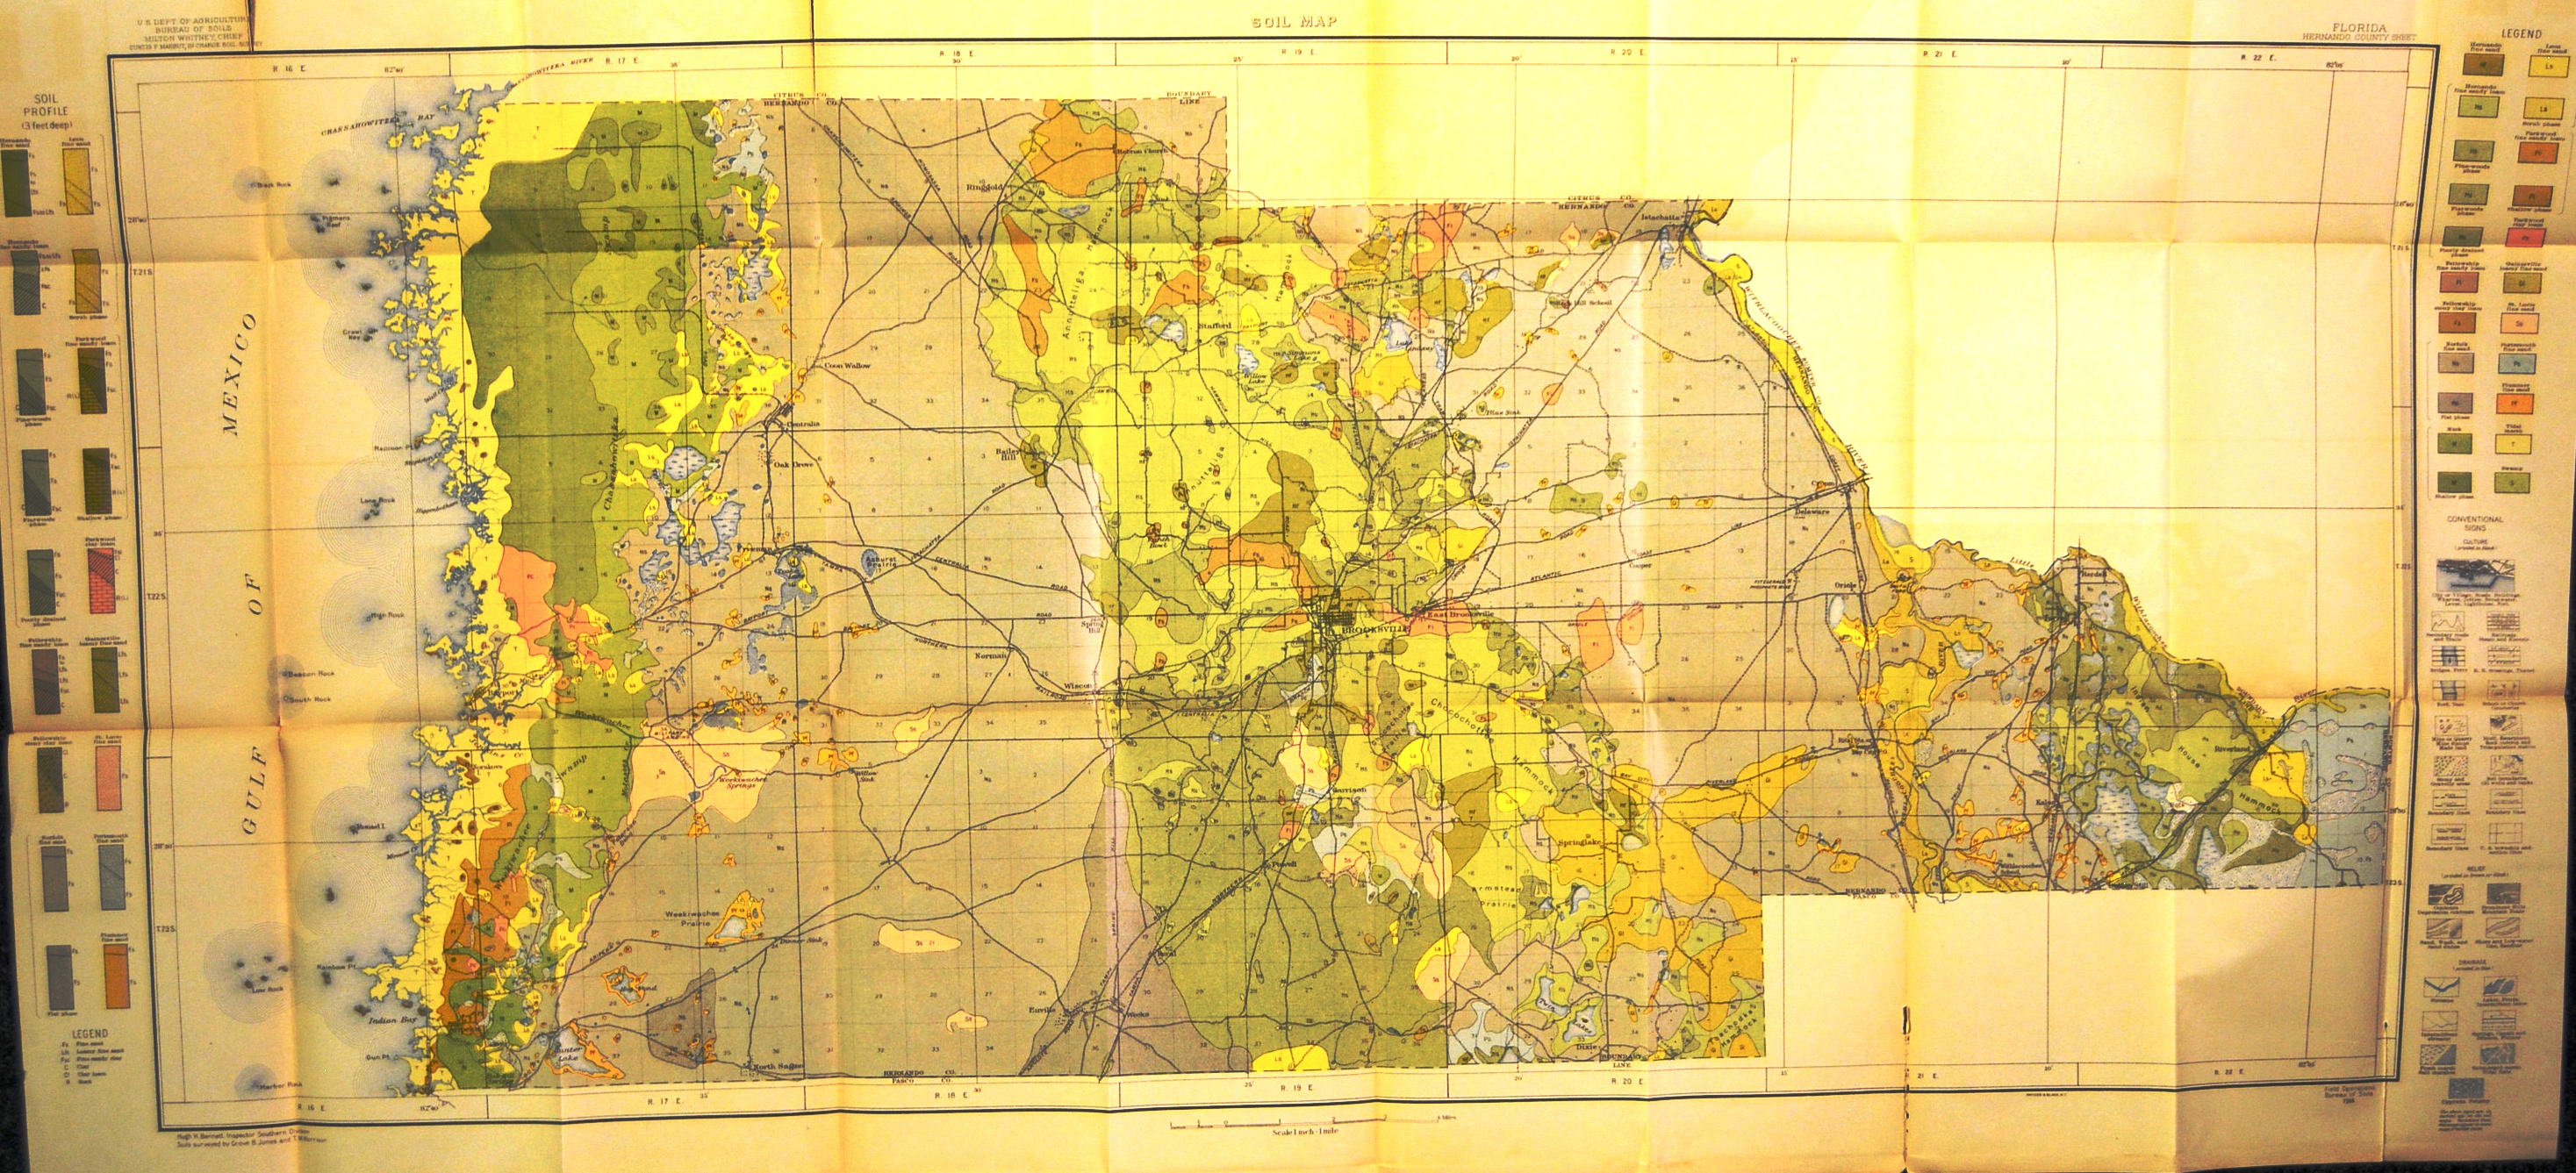
While Florida’s soil is mainly sandy, and lacks granite and the other kinds of rocks found elsewhere in the country, the soil is still very chemically complex. Some are better for farming, others contain phosphates and chemicals suitable for mining. To help with the economic development, scientists needed to know the exact distribution of the resources. So teams of samplers would cover an entire county, taking soil samples for analysis and noting changes in elevations, to pinpoint the resources. The results of this painstaking process were scientific works of art, almost a water color overlaying a political map.
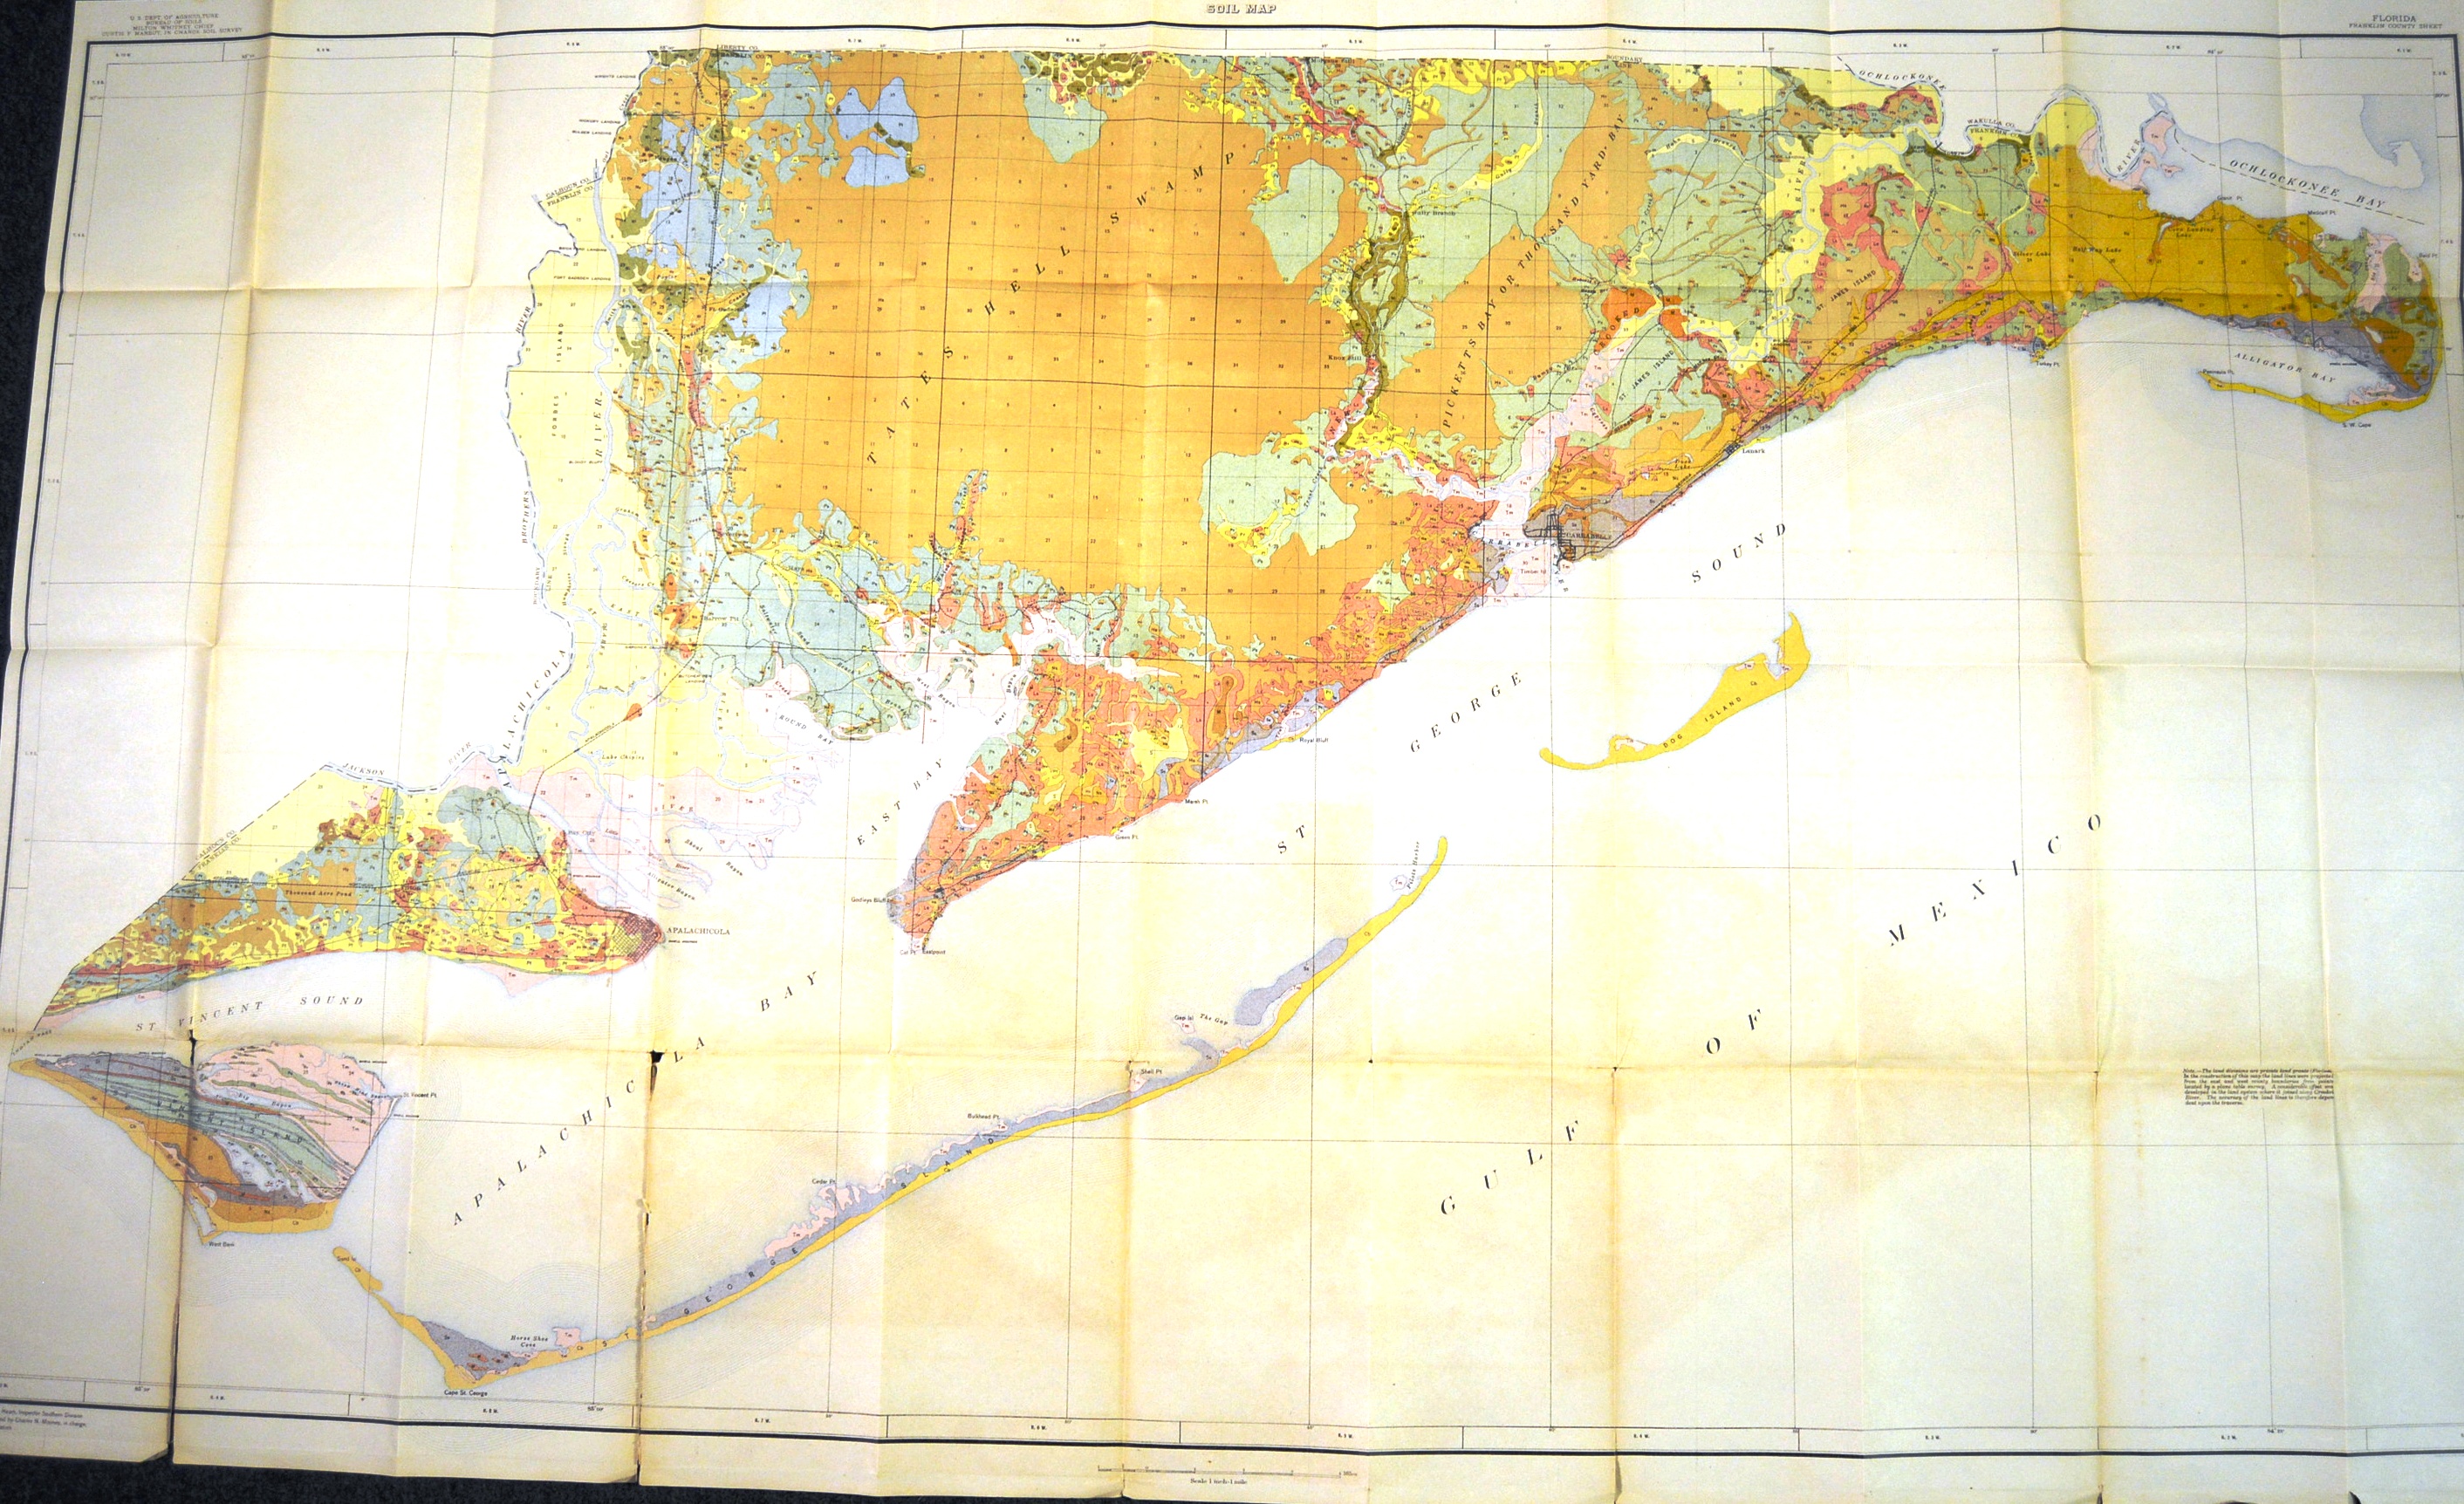
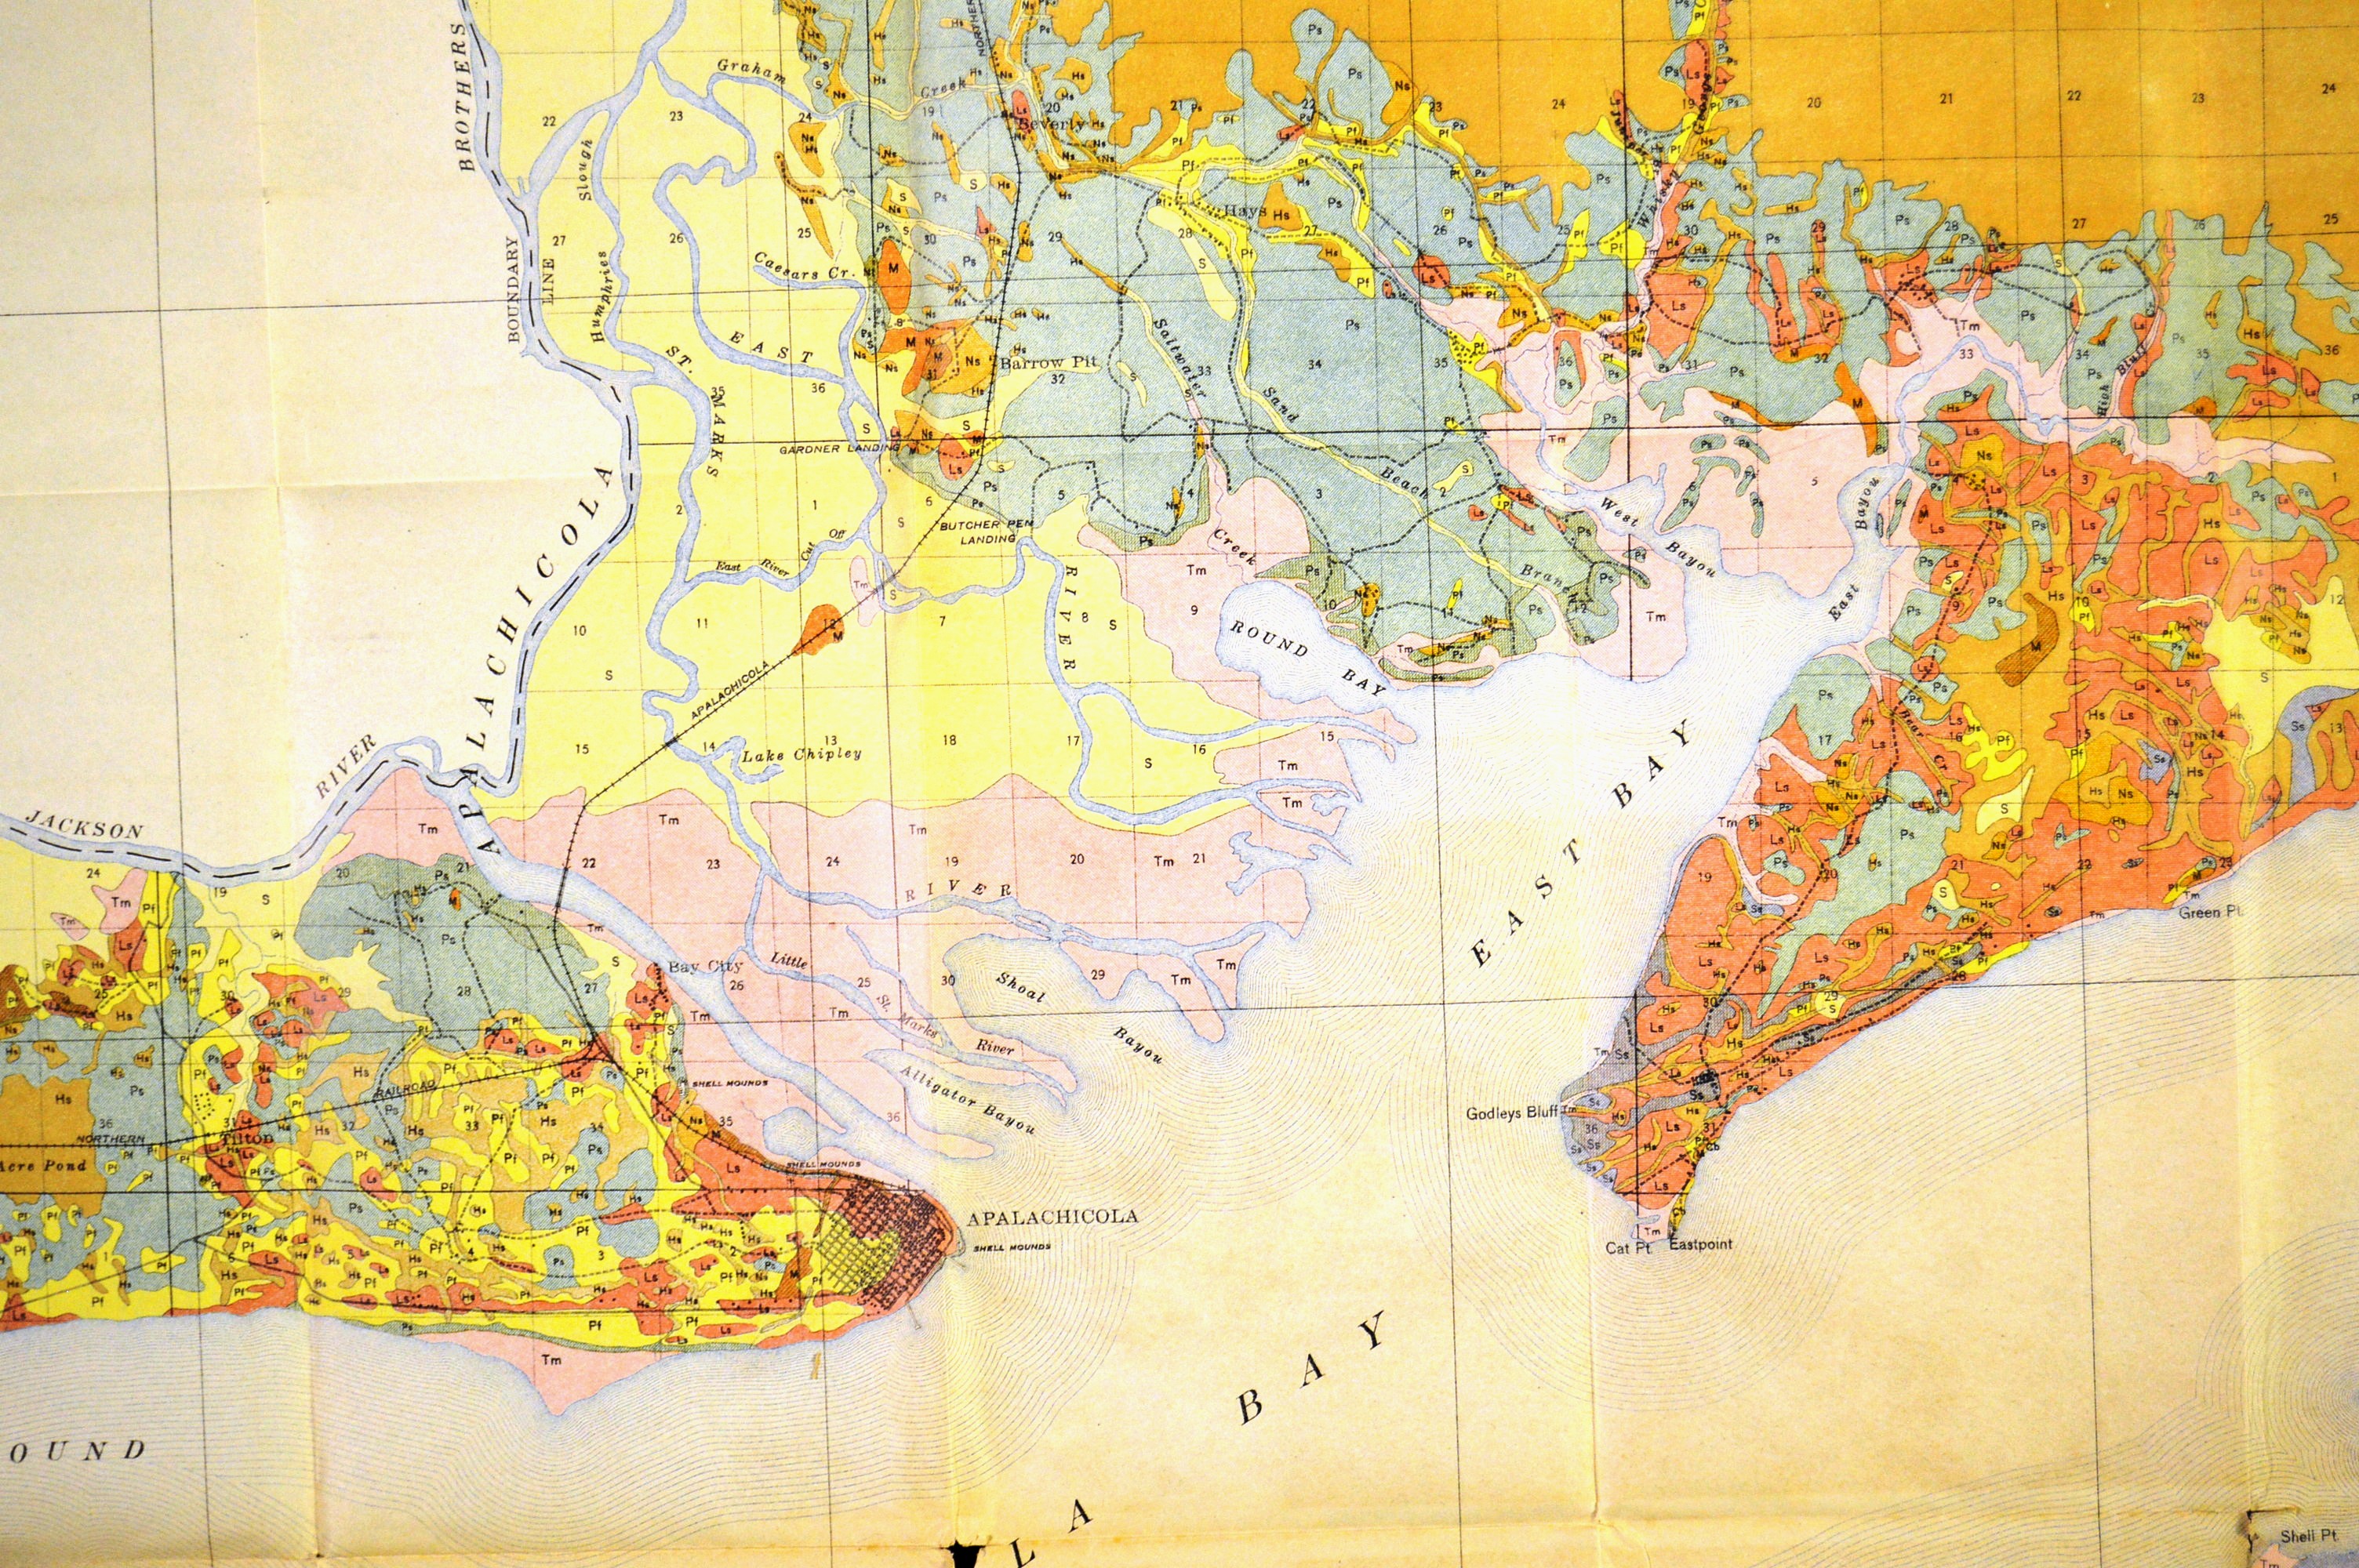
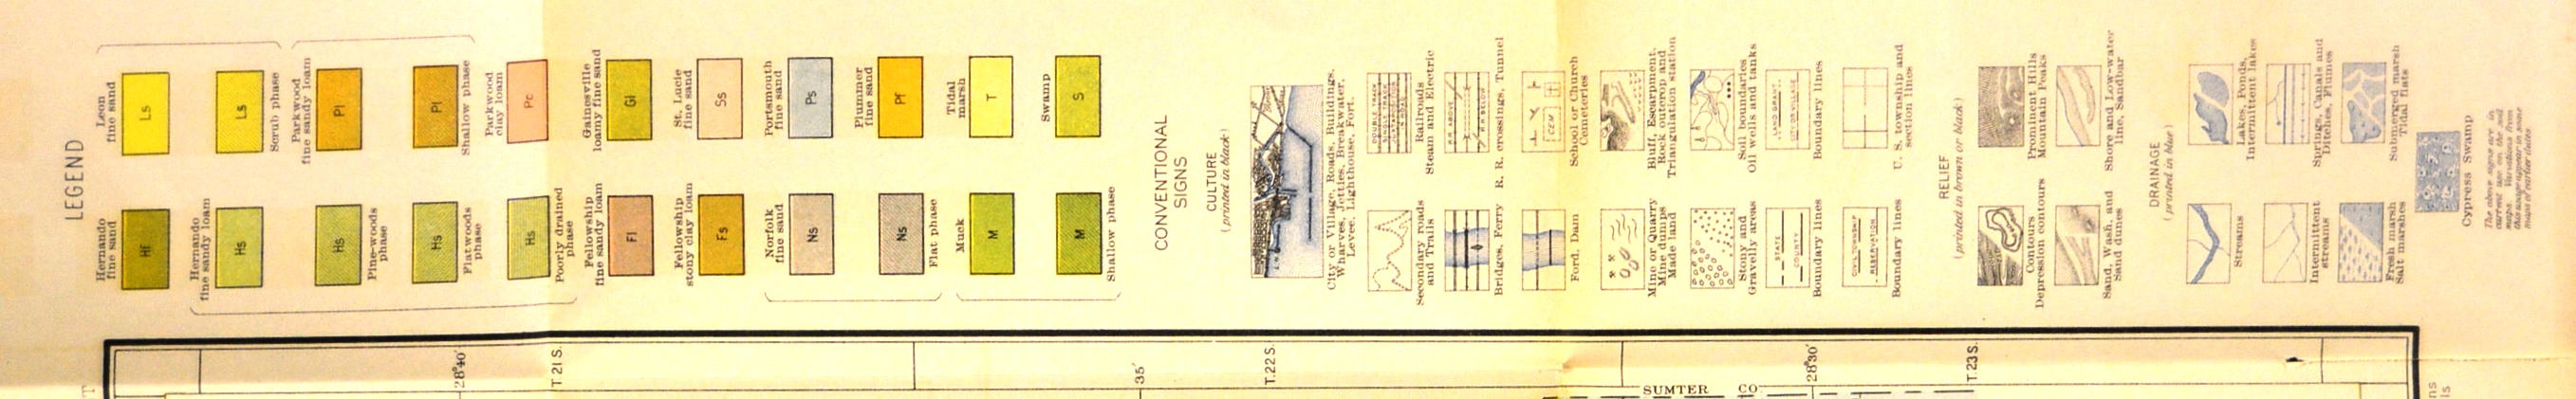
The various shades of blues, pinks and greens may appear to change for no reason, but it is nature at work and a key on the side of the map tells the viewer what kind of soil is represented.
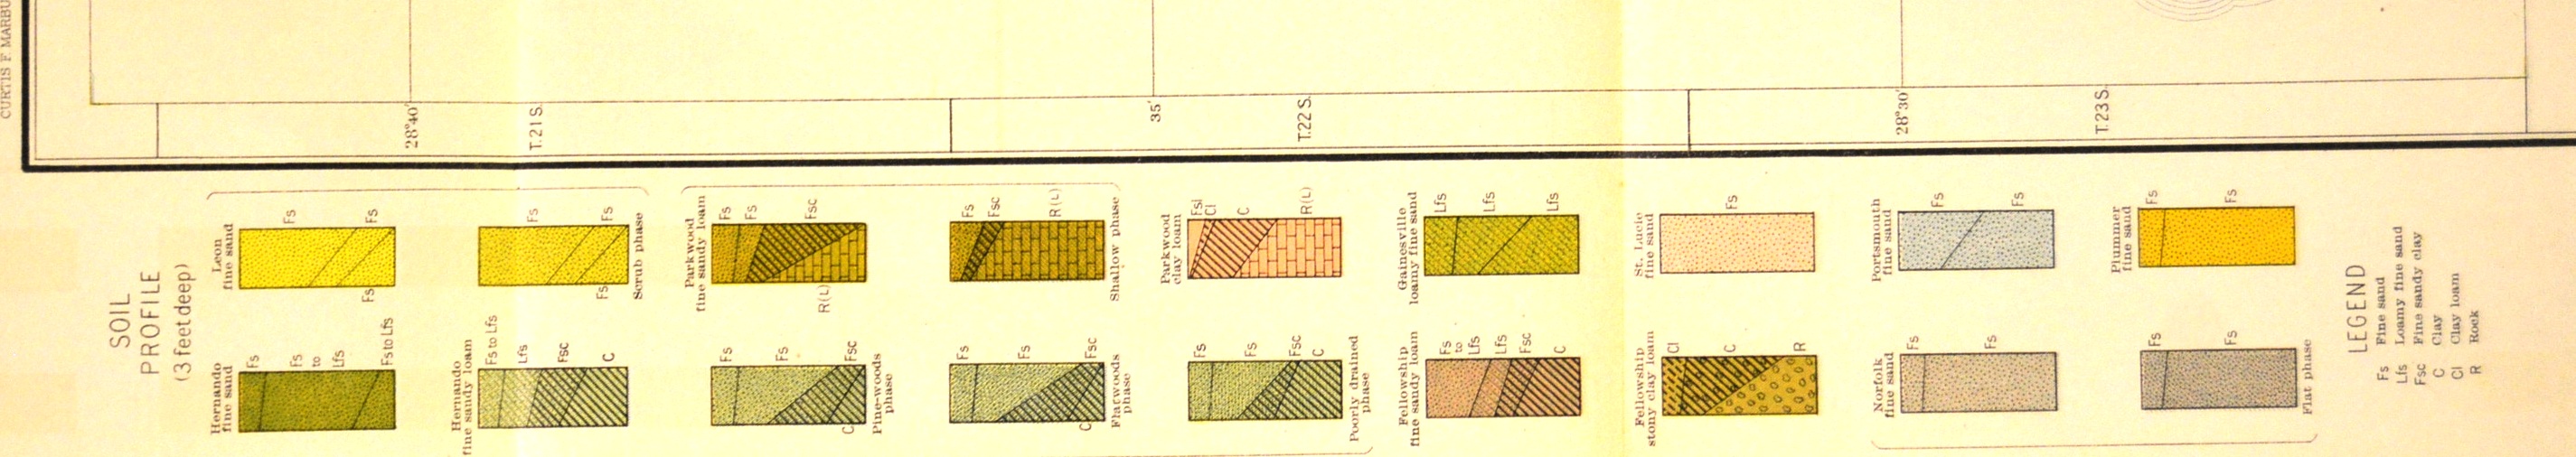
Over time, the sophistication of the science improved, and the keys show how much more detail the later maps can display.
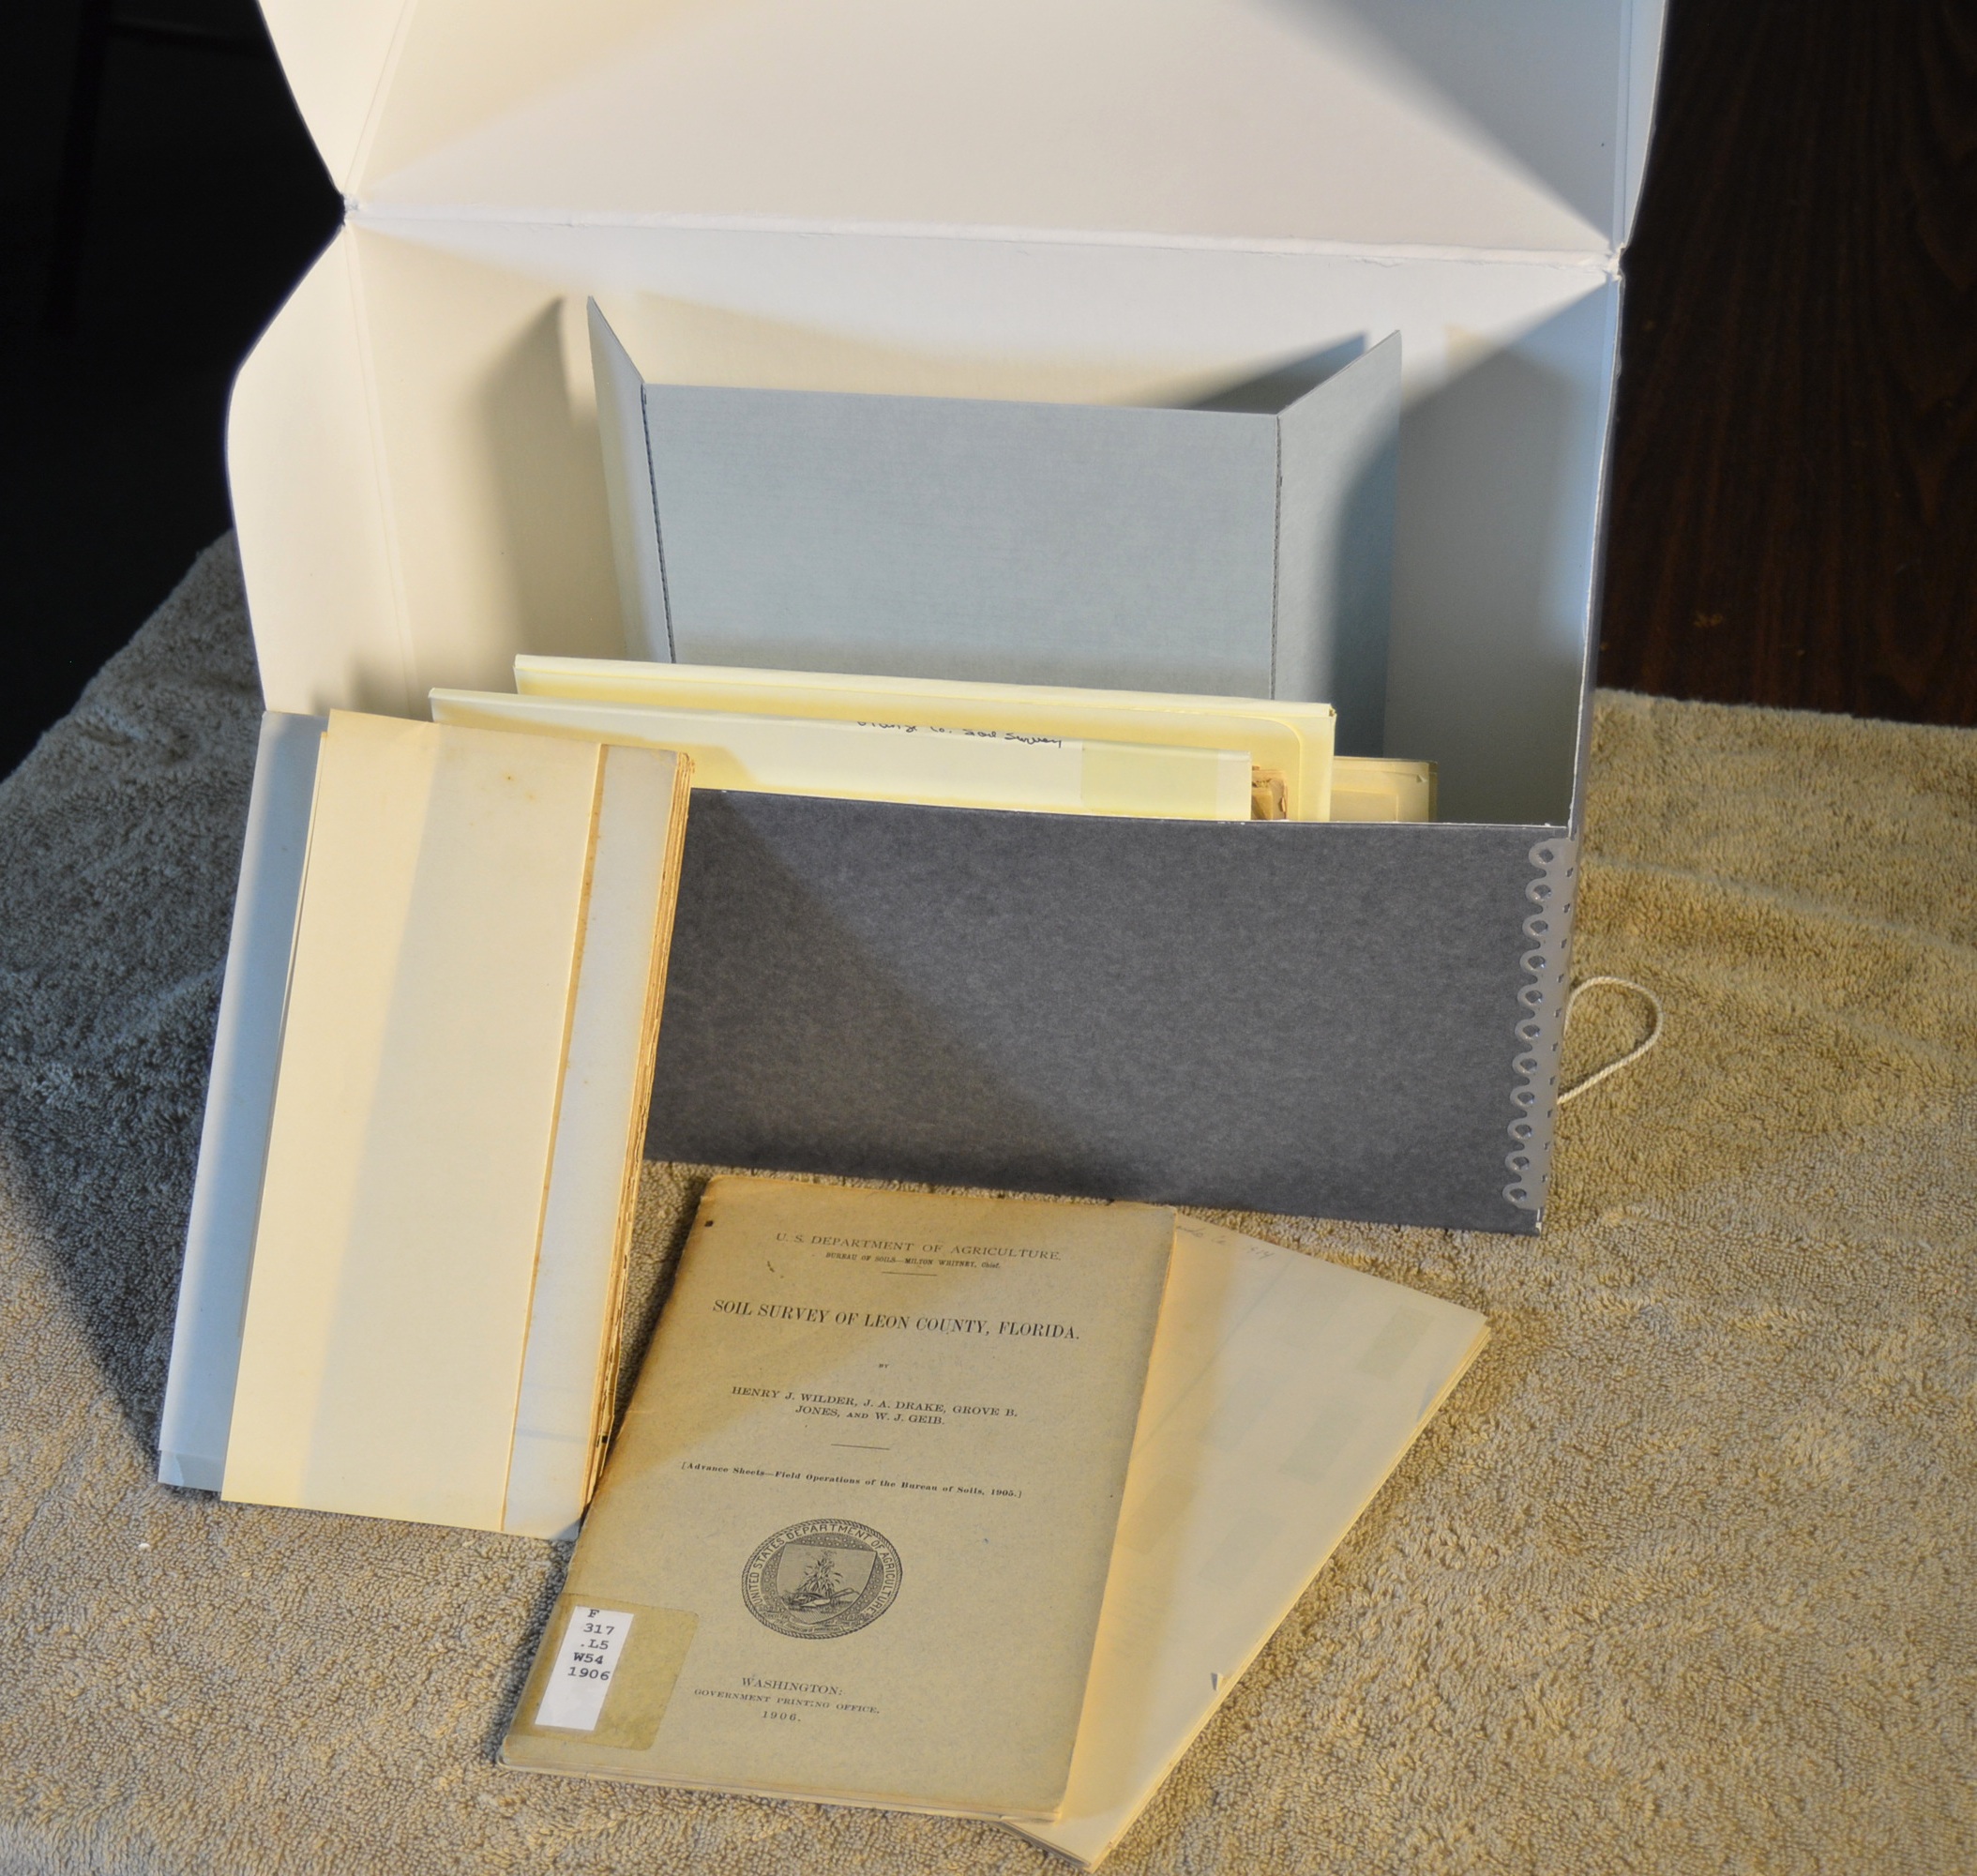
The earliest Soil Survey Map at the Library of Florida History is of a 1905 survey in Leon County, printed in 1906.
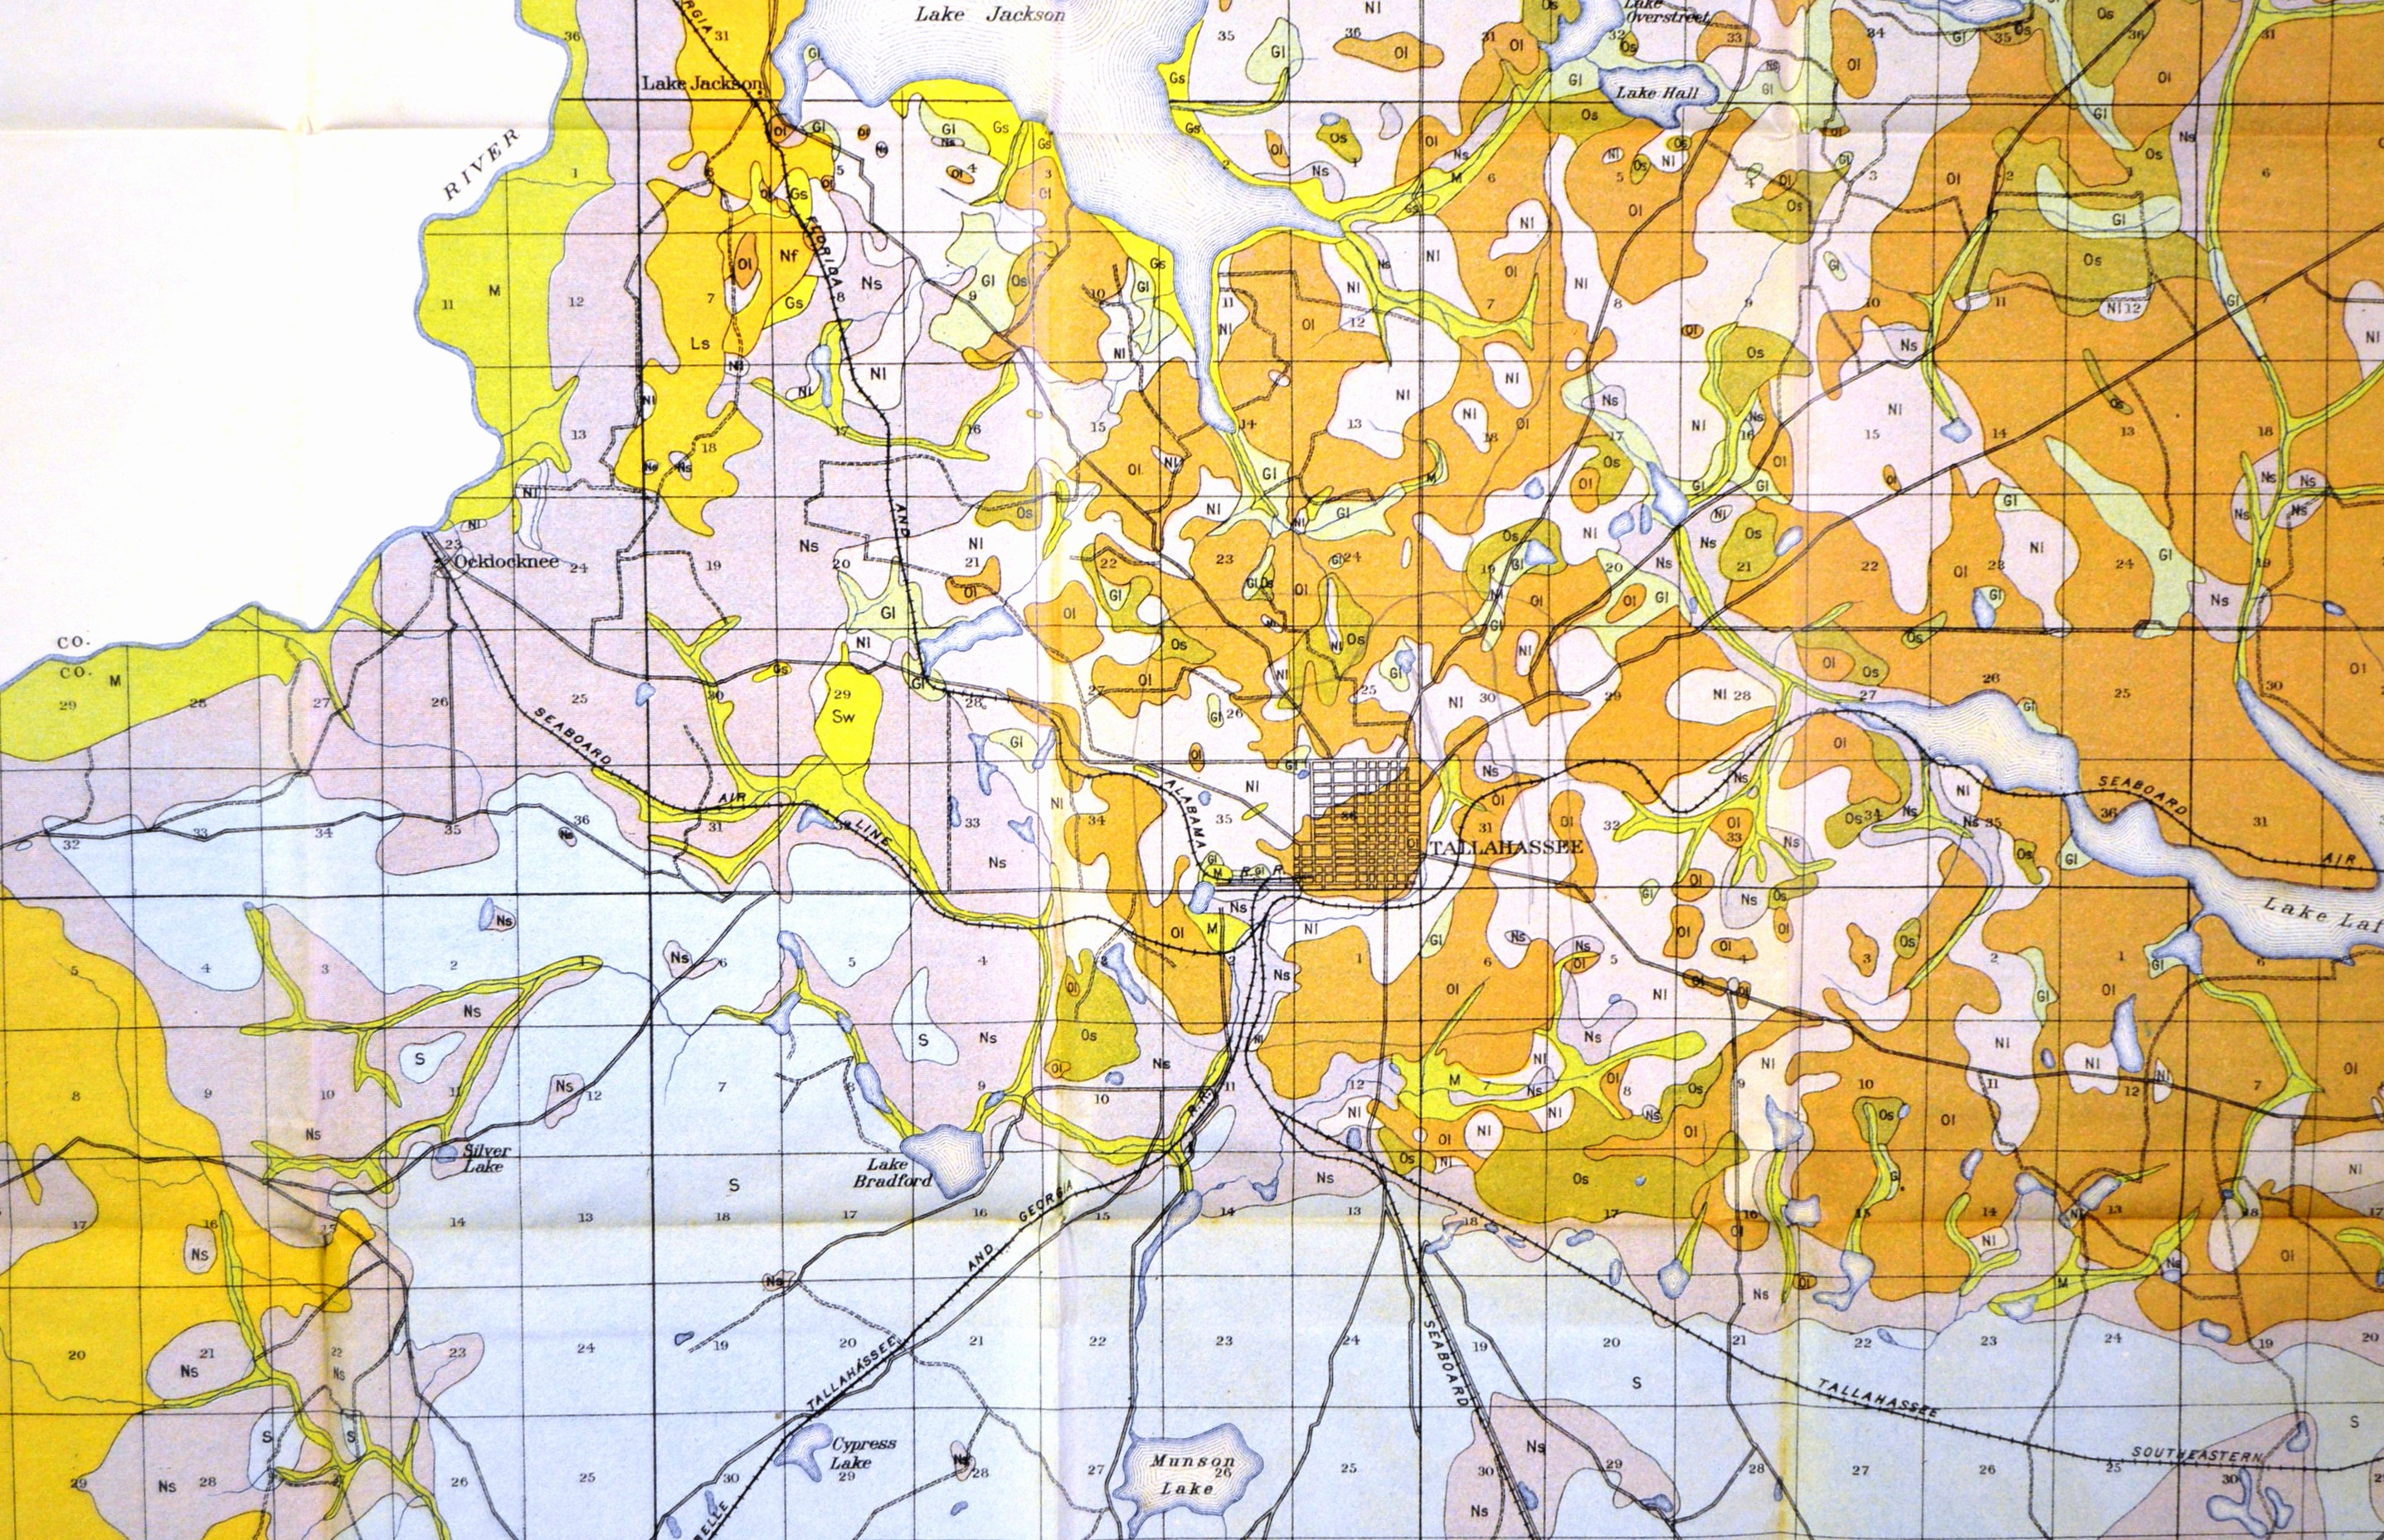
This is where you can begin to see the historical importance of these maps.
They show streets, railroads and buildings, a contemporary aerial view of the state capital from over a century ago.
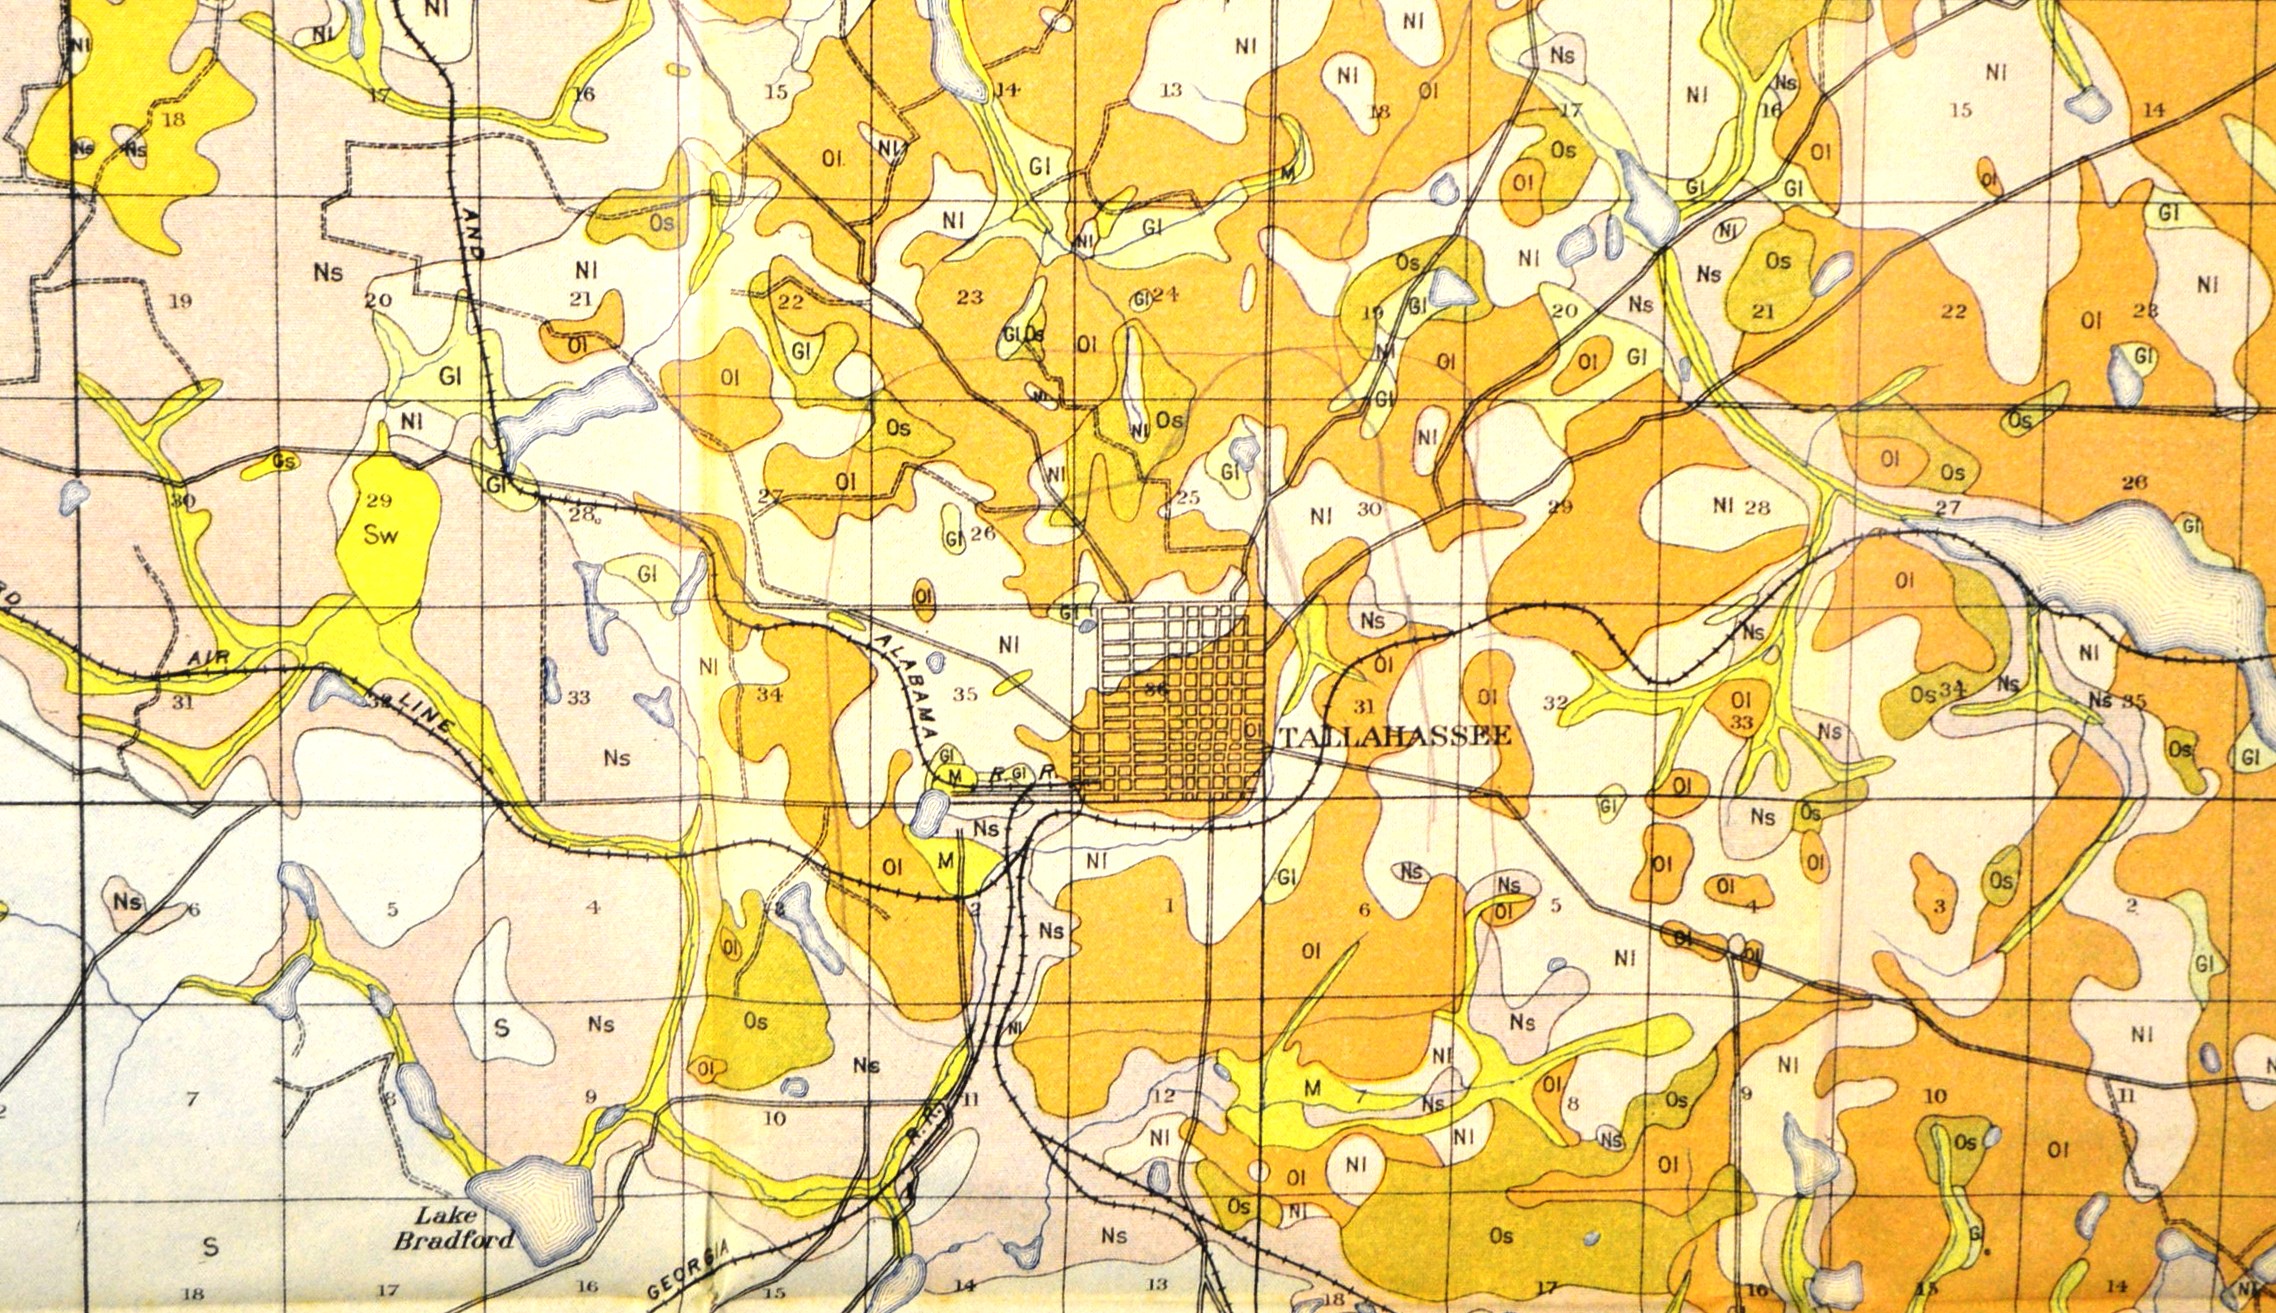
By close study of these maps, showing the relationships between buildings and soil type, researchers can better understand why development took place where it did. It can also reveal underlying soil types that can still be important for proper urban planning.
Not only do the older maps show where vanished buildings were located but also the extent of the now dismantled railroad systems.
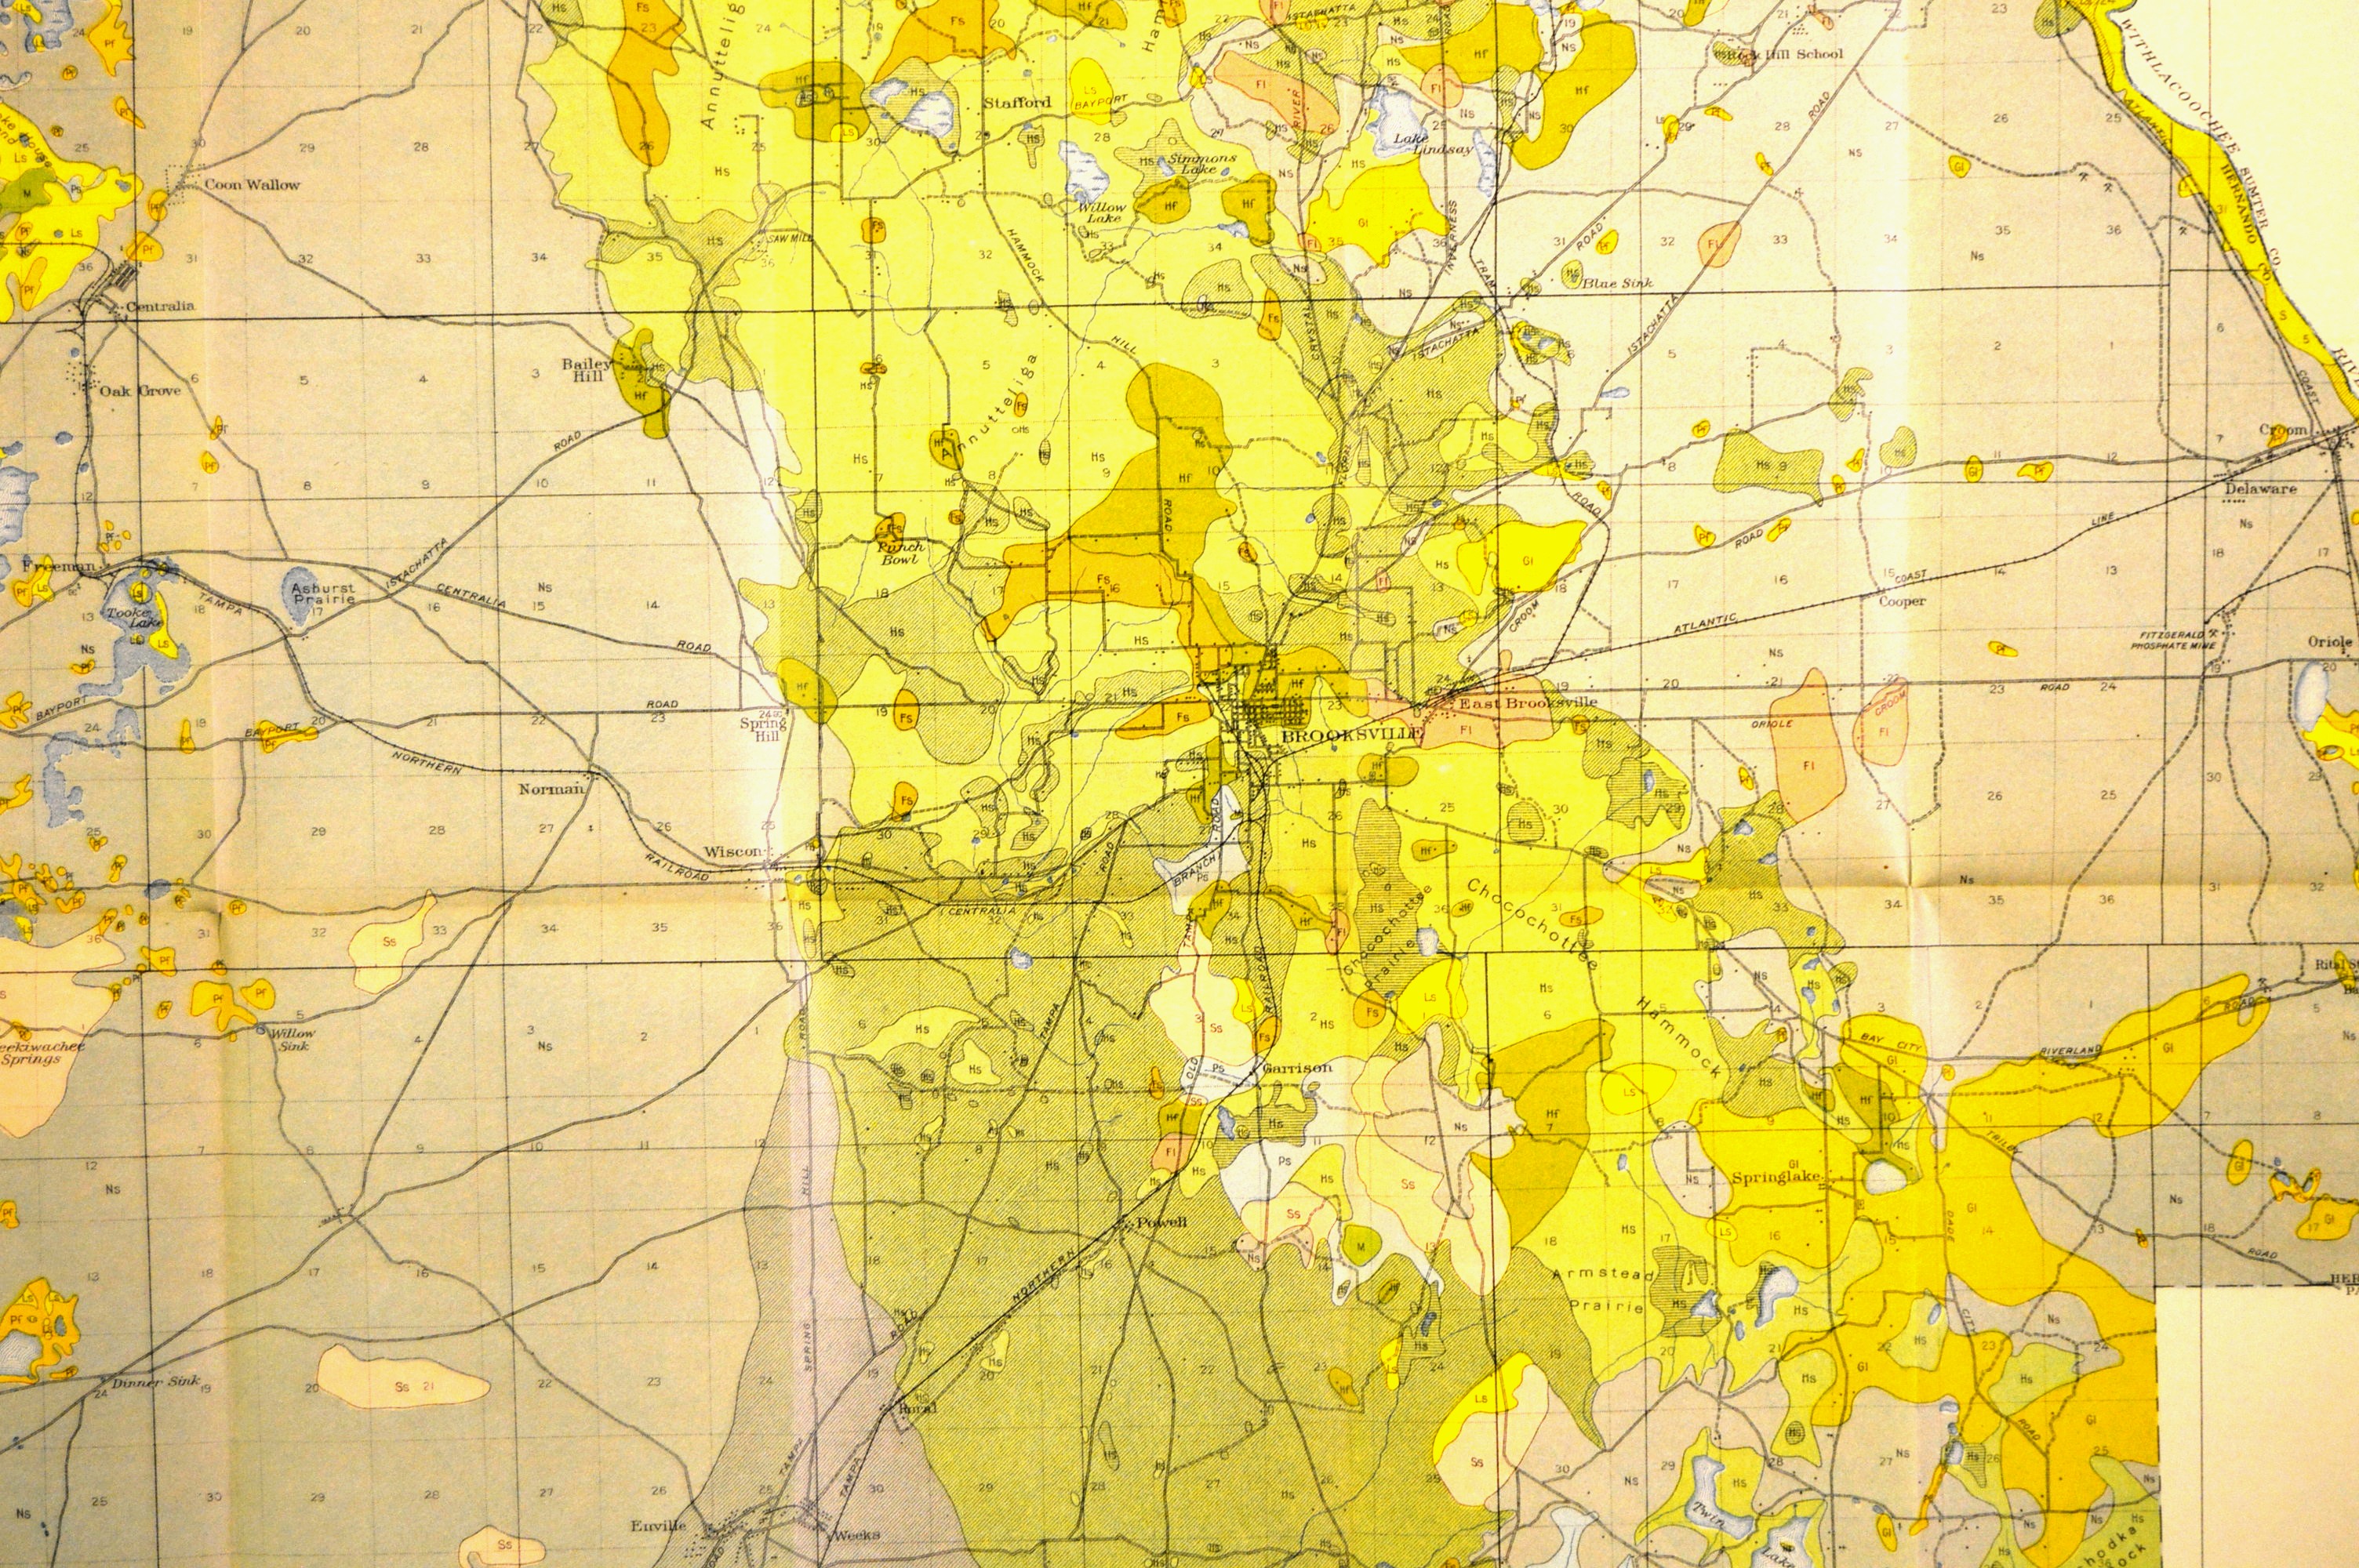
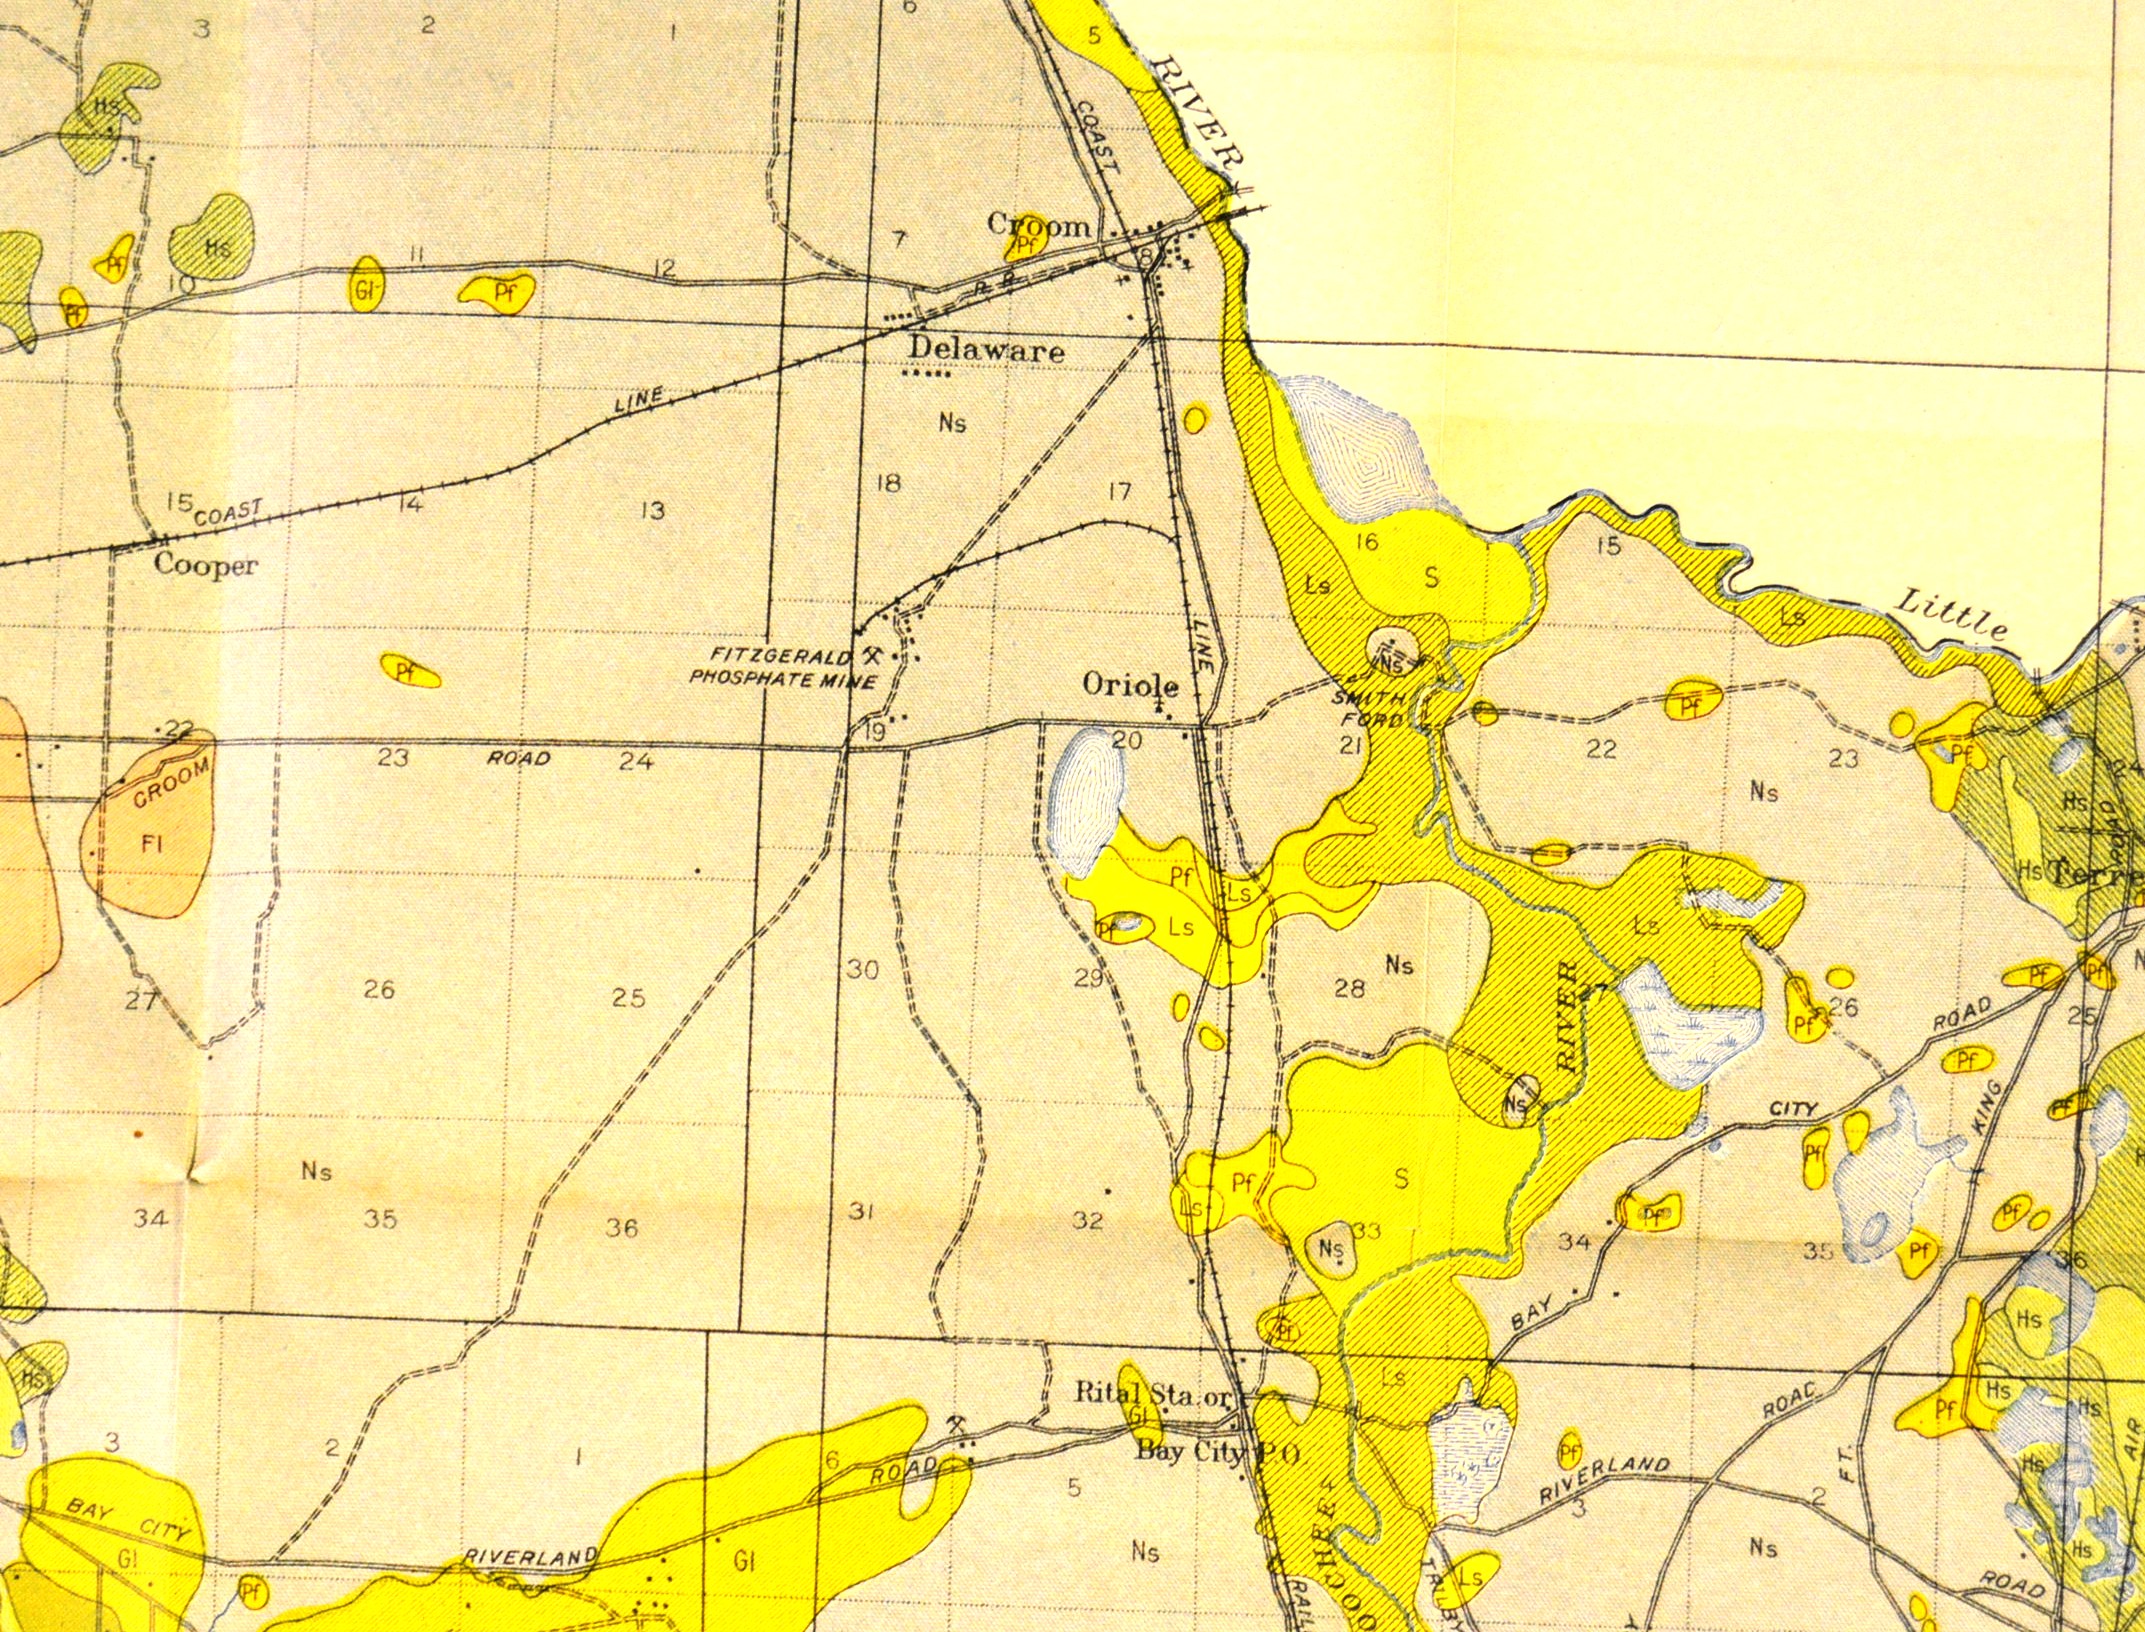
For example this Hernando County 1927 map shows a phosphate mine, the Fitzgerald, the railroad spur and the trails leading to it. It is all gone now, but urban planners, politicians and community members need to know about that kind of history of a tract of land to understand the evolution of use of a particular area. What began as an effort to help farmers and leaders at the state level to plan and develop where large farming should take place, still has a role to play for historians and for all who are concerned about land use, environmental issues and even public health.
Maps from all over the state are available at the Library.